Buongiorno from 2 degrees C snow now melting Wetherby UK ![]()

Before i ask the question please be aware I’m a complete Javascript noob which gives me a temporary license ta ask the ridiculous!
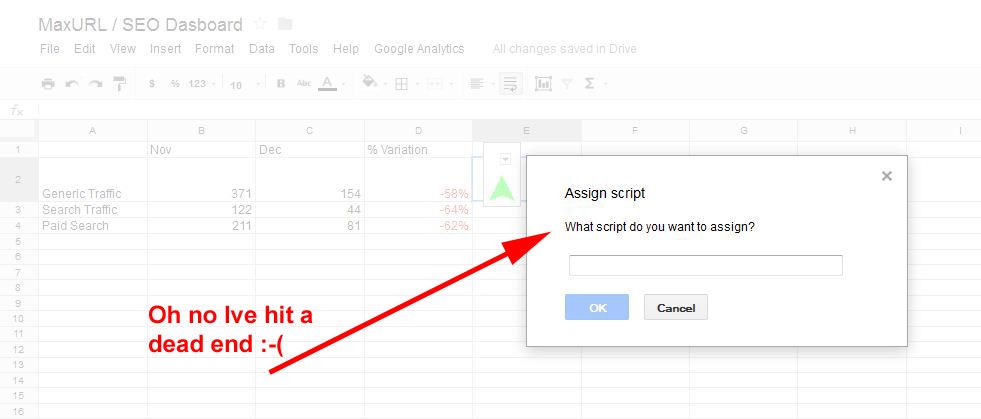
Ok here goes. Ive got a spread sheet that compares one months traffic to another and expresses the results as a percentage illustrated here http://i216.photobucket.com/albums/cc53/zymurgy_bucket/assign-script-arrow_zpsf18d816a.jpg
Now ive learnt in Google Excel Docs you have to know JavaScript to do what i want. What i want to do exactly is show a green arrow for positive values and a down turned arrow for red using conditional formatiing.
So my question is please:
“What piece of Javascript would i need to look at to trigger different graphics depending on positive & negative values”.
Thanks to anyone that tries to answer this ![]() It aint going to be easy me thinks…
It aint going to be easy me thinks…
David