I am building an event-driven particles collision simulation. For reasons I cannot identify, the code is running too slow as you can see for yourself in the demo. I have a considerable knowledge of Chrome Dev Tools but don’t know every nook and cranny of it. Thus I am unable to pinpoint the root cause of slow performance. Notable, really similar algorithm in Java is being able to handle thousands of particles without a twitch.
Here is the demo running 50 particles, the more particles, the slower it gets:
http://codepen.io/zerobrainwash/pen/817223aaf0e55909fffb32019dbf237d
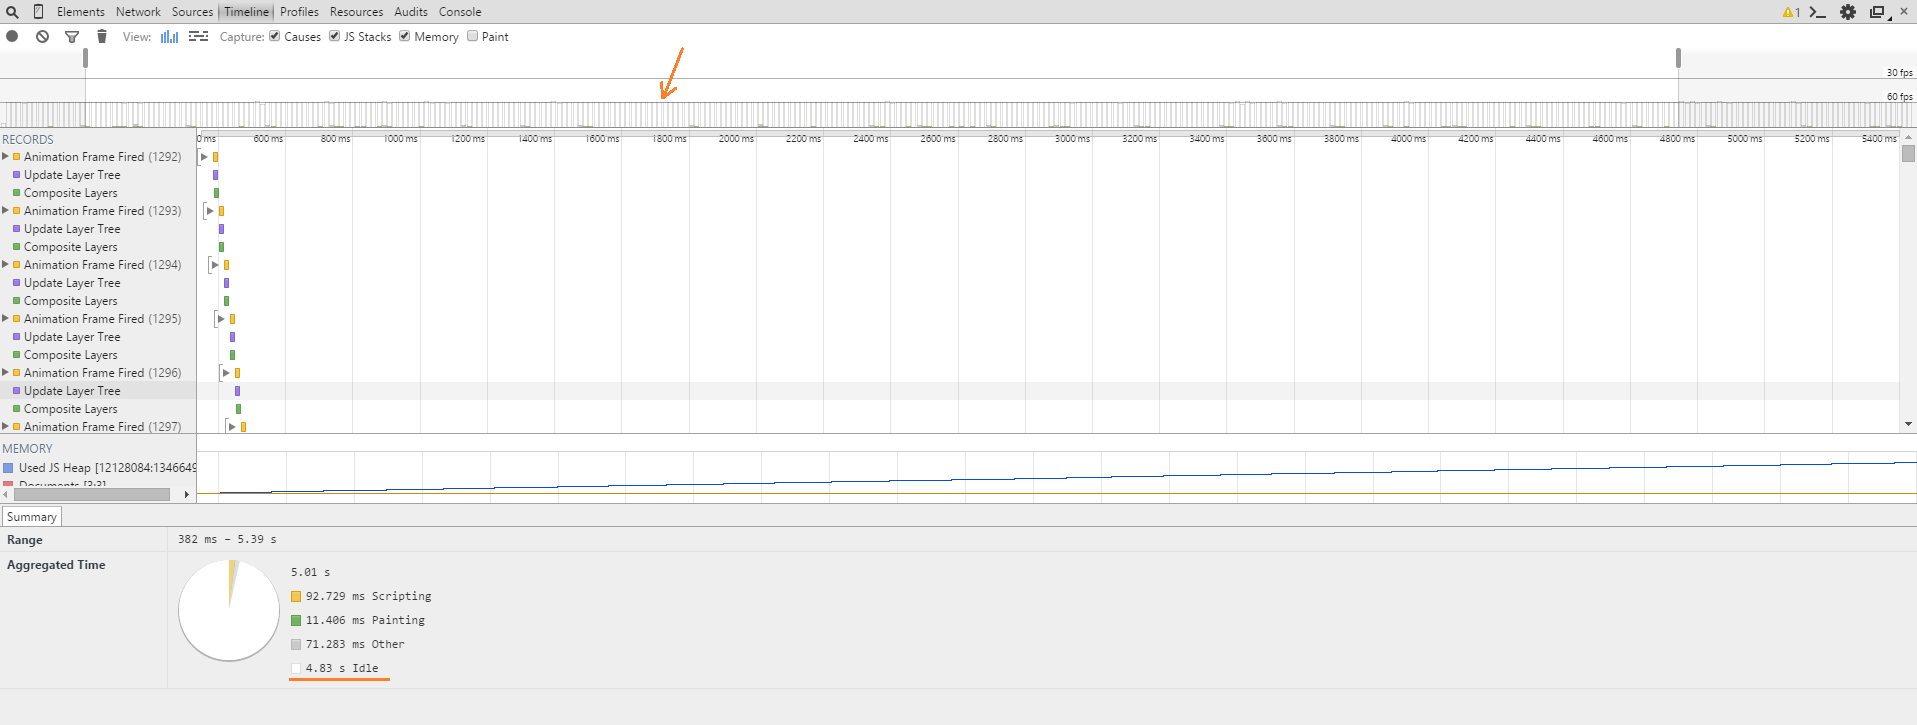
My biggest concern is long idle times in each frame. Out of 5 seconds profiled, over 4 seconds are spent idle. Does anyone have any idea what’s that all about and where should I look to identify the performance bottleneck? I have experimented with different ways to draw particles but that doesn’t seem to be it.
To give a brief overview of the algorithm, it uses a priority queue implemented with binary heap as underlying data structure. The occurrence of all events is being predicted in advance and with each frame, the event with ‘smallest time’ is handled. So if the algorithm has been running for 18seconds and the closest event after 18seconds threshold is a particle bouncing off the wall, that event will be handled and taken off the priority queue. This is supposedly a faster algorithm that is able to handle much larger amounts of elements being simulated than time-driven simulation. Here is a nice little intro if you’re interested to learn more http://www.slideshare.net/TBear76/event-driven-simulation-the-concept.